Call center analytics: how to measure performance
 | March 14, 2025 | 6 min read |
Key Points
- Learn how to measure call center and agent performance.
- Take a look at the basic metrics available.
- Go deeper with advanced analytics.

A call center can be a lifeline for your business, but the brain behind the operation is call center analytics. Taking a hard, data-driven look into how your team is handling clients or customers on phone calls can help you boost not only your customer satisfaction numbers, but your bottom line, too.
What are call center analytics?
Simply, call center analytics look at the phone calls your sales or customer service agents have with customers or clients and collect metrics and key performance indicators (KPIs). These metrics and KPIs are then measured and presented in various graphs and charts.
Tracked metrics include the total number of incoming, outgoing and internal calls, average call duration, the number of missed calls and more.
Analyzing this data can help you manage your agents and have the right coverage for peak calling periods. You can even add in things like call recording to review specific calls to give you and your staff a better understanding of what’s going wrong or right and a clarified path to betterment.
Dive deeper: Call Center vs. Contact Center
How can I measure call center performance?
Now that you know the basics, how can you use these call center metrics or KPIs to make a difference? The best way is to look for trends in the numbers. While statistics and metrics can be helpful, the way you look at them and the patterns that emerge are what really make them useful.
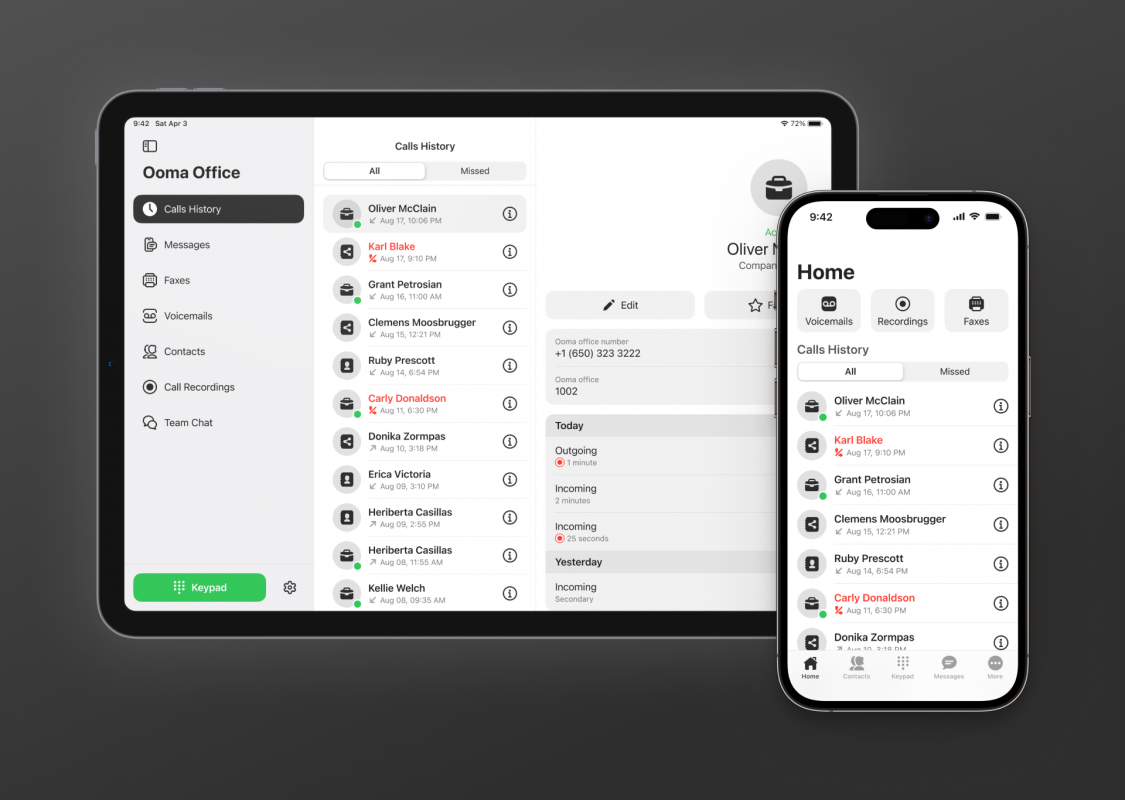
For example, here are some ways you can look at call center analytics in Ooma Office Pro and Ooma Office Pro Plus and how you can use them.
Call volume trends: This is a daily summary of call types, which include incoming, outgoing, missed and not connected. This will let you see how many of each type of call you get a day and the time periods when these calls are coming in during the day. So if you notice a number of calls were missed during a certain part of the day, you can do some research to find out what happened, then figure out if it was a one-time fluke or something you need to address to prevent it in the future.
Call metrics by day of the week: This is an average of call metrics broken down by day of the week. This allows you to zoom out a bit more and measure performance day by day. This can help you see that you get more calls on Monday than Tuesday, or maybe that you miss more calls on Friday. With this information, you can better direct agents or adjust staffing during the week to either meet call volume or reduce missed calls.
Call metrics by hour of the day: This is an average of call metrics broken down into three-hour intervals throughout the day. Importantly, this metric includes all days of the week in the average. So, for example, the 9 a.m. to noon block is an average for all work days, not just a singular day. This allows you to better see what hours are busier for you. For example, if you know mornings are when people call, you should tilt staffing toward mornings rather than afternoons.
Call distribution: Heatmaps are a wonderful visual way to look at the summation of your calls. With this metric, you get a bird’s-eye view that combines call metrics by day of the week and also by hour of the day that allows you to see which times are busier than others.
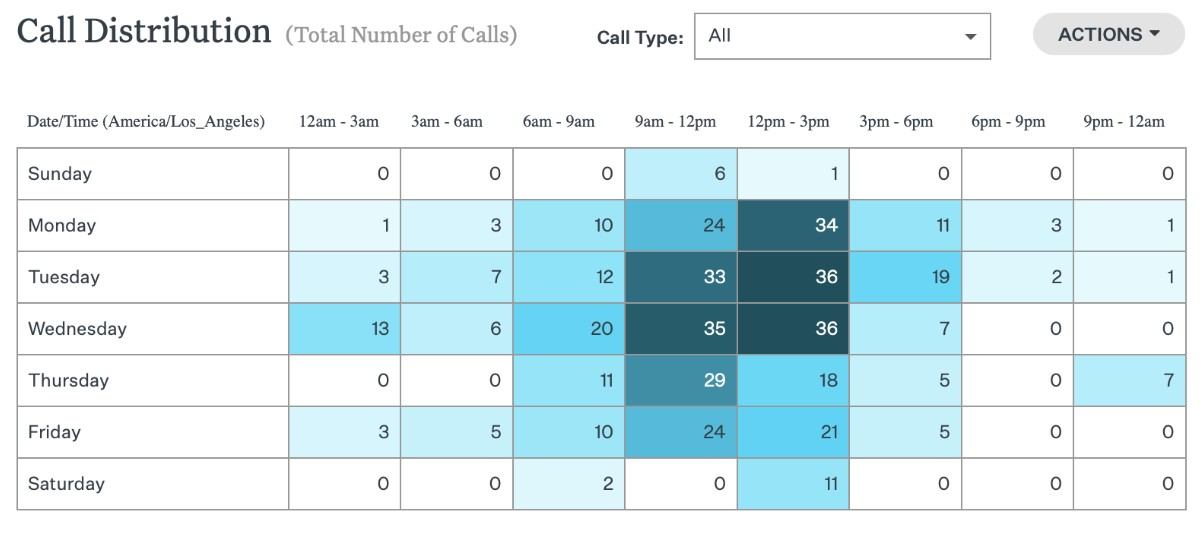
Heatmaps are charts that use color to represent data. For example, on this heatmap the busier a time block, which is counted as a three-hour interval, the darker the color used for that block. The less busy a time block, the lighter the color.
Time period: This allows you to zoom out or in on your call center metrics, choosing a specific time range for you to visualize calling data.
Going deeper
While the above call center metrics can give you a basic way to look at your performance, you can go deeper with your VoIP system. Here are more metrics included with an Ooma Office Pro Plus feature called Call Queuing that can give you a stronger look at your call center performance.
Abandon count: Abandons are when the caller stops waiting for someone to answer and hangs up. This will help you better see when the caller experience is being negatively impacted. If customers feel like they’re waiting too long and give up, you can do things to improve the experience, like adding more agents or including soothing music the caller can listen to while they’re waiting.
Time out count: A time out isn’t a customer taking a break from waiting. It means that the phone call has been disconnected because the system was waiting for a certain amount of time for a response, which can mean being picked up or passed on to someone else, and there was no response.
Average wait time: This shows you the average time that callers are waiting to talk to someone. Higher wait times, especially those over a minute, are understandably frustrating for callers.
Missed calls: This metric allows you to see how many calls an individual agent has missed.
Rejected calls: Rejected calls are calls rejected by the agent. If the rejected call number is high, there’s a good chance the agent is overwhelmed with too many calls.
Average duration: This looks at how long an agent is on the phone with a caller. The higher the number, the more issues they’re likely running into. This can tell you a lot about the effectiveness of your agents. If all of them have high average durations though, it may point to deeper problems, like product defects.
Average ring: This shows how long it takes for an agent to pick up the call once it’s transferred to them. The longer the ring time, the longer a caller waits.
Interpreting the data
Data can be overwhelming, and when your call center analytics platform throws data at you, it can be difficult to know where to start. So if you’re looking into how you can measure call center performance, you should start with the questions you most need to answer.
For example, it can be valuable to keep in mind customer satisfaction (and customer satisfaction scores if you’re gathering them). Where are the missed calls happening, when are high-volume times, how long are the calls taking and are many callers hanging up before connecting with an agent?
If you begin with those things in mind and look at the data, you will start to find the answers you need to improve your call center operation.
Put yourself in the position to win
When you master call center analytics and effectively use them to improve the performance of your agents, you put your business in a position to grow and be more successful. However, don’t just rely on call center analytics to power you through.
It’s important to partner analytics with customer surveys and call recording so you can better manage your staff and make deeper improvements. For example, some call center platforms allow you to also look at statistics by agent, to see how an individual is performing.
So whether you’re looking for a way to measure an existing call center or shopping for a new small business phone service that comes with analytics, keep these metrics in mind to find the best solution for your business.
If you’re looking for more information, you can always check out our call center tips or IVR best practices guide.

Learn more about how Ooma Office can help your business.
Thank you!
An Ooma Office Sales Representative will be in touch shortly.
866-573-0707


Learn more about how Ooma Office can help your business.
Just call 877-621-0515 or click this to CHAT. Or, fill out this form and someone will reach out to you shortly.
Nandhini is a Senior Product Manager at Ooma, focusing on communication solutions, leading new product introduction, growth, and engagement for Ooma's business offerings. Nandhini has over a decade of experience building innovative products from the ground up and crafting solutions that delight customers. Nandhini holds a Master of Business Administration from University of California, Davis.