The most (and least) connected cities in the United States
 | August 2, 2024 | 5 min read |
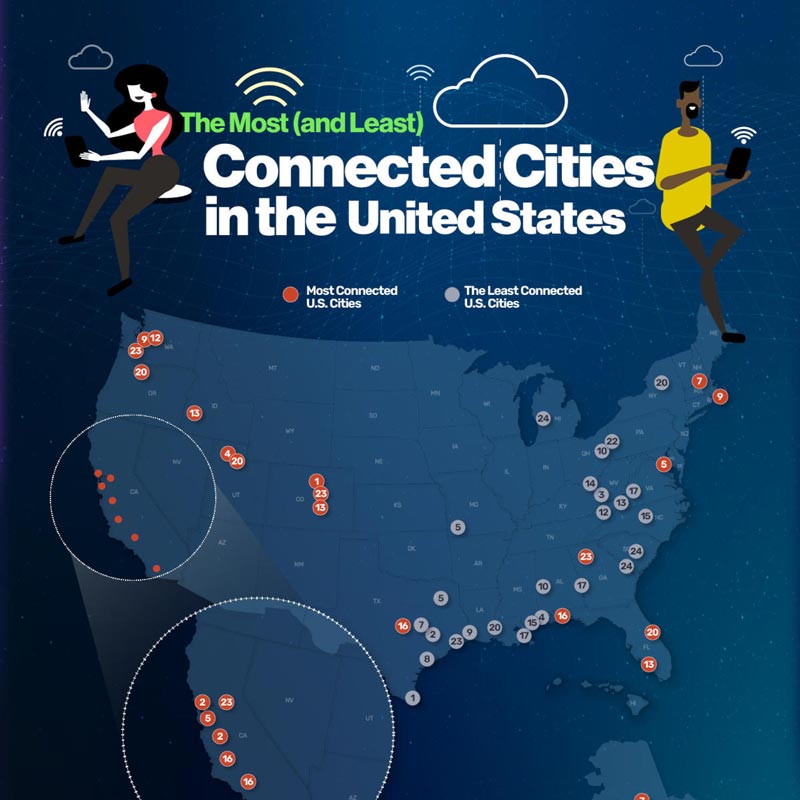
Nowadays, everyone seems to be connected to the internet in some form, whether through broadband, a cellular data plan or satellite; but you may be surprised to learn that nearly one in every 10 U.S. households is without internet. Which cities are the most connected to the internet, and which are the least? The team at Ooma.com analyzed data from the American Community Survey to determine the U.S. cities with the highest rate of households connected to the internet through broadband of any kind, as well as the cities with the most households that do not have an internet subscription of any sort. How many methods are used in your home to connect to the internet?
Which is the most connected city in the U.S.?
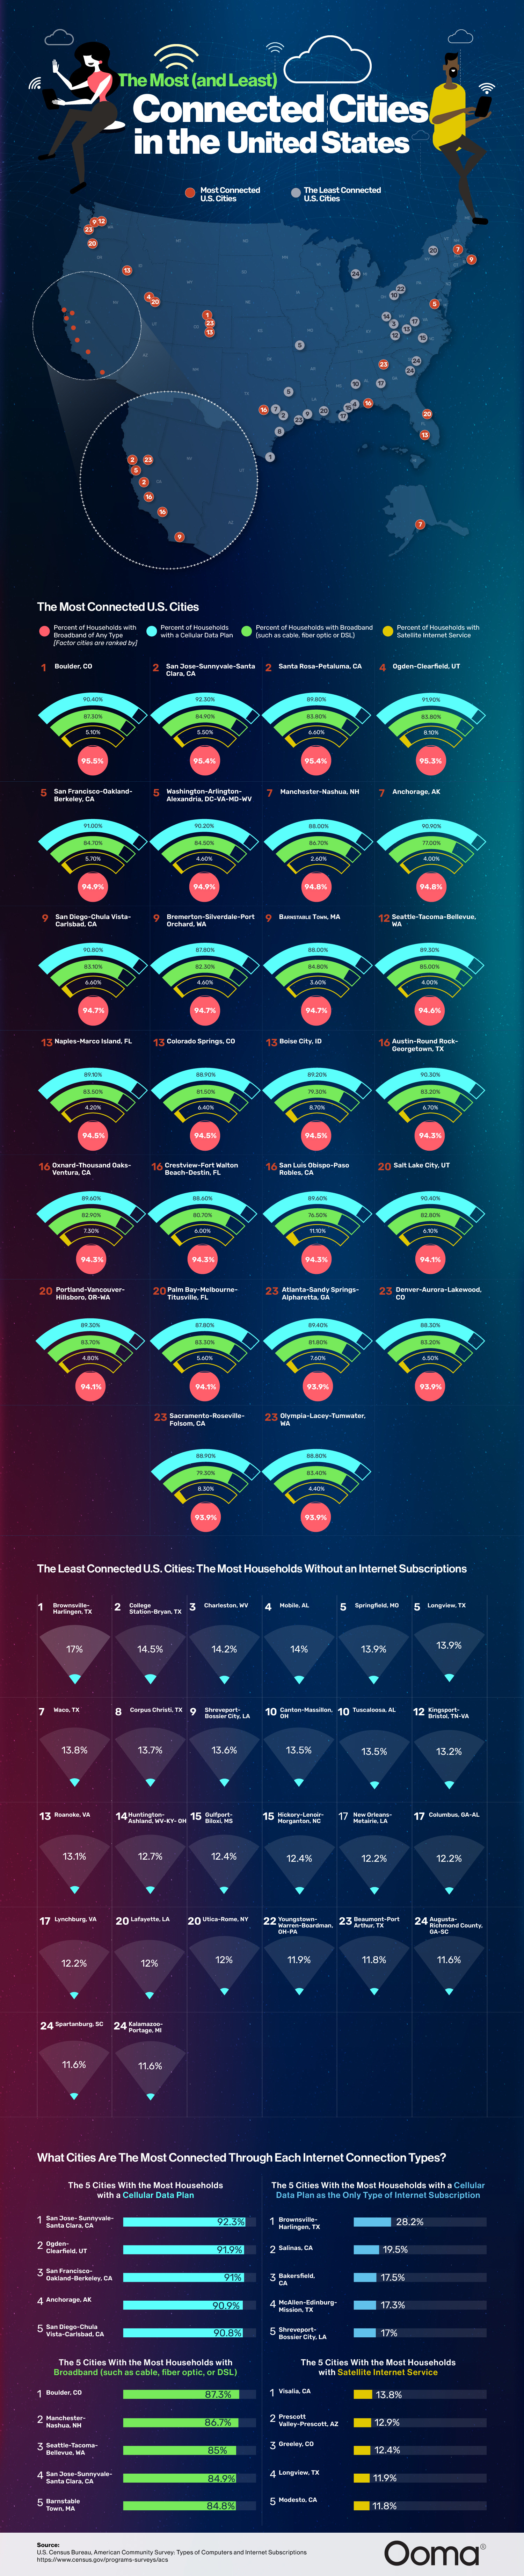
The most connected city in the United States is Boulder, Colorado. The metropolitan statistical area centered on Boulder ihas 95.5 percent of its population connected to the internet through a connection of any type. Of the 137.8 thousand households in Boulder, 90.4 percent have a cellular data plan, and 87.3 percent are connected to the internet via broadband such as cable, fiber optic or DSL. Just 5.1 percent of the metro area’s population has access to the internet through satellite services.
The 10 most connected cities in the U.S.
- Boulder, Colorado: 95.5 percent
- San Jose-Sunnyvale-Santa Clara, California: 95.4 percent
- Santa Rosa-Petaluma, California: 95.4 percent
- Ogden-Clearfield, Utah: 95.3 percent
- San Francisco-Oakland-Berkeley, California: 94.9 percent
- Washington, D.C.-Arlington and Alexandria, Virginia, and parts of Maryland and West Virginia in the metro area: 94.9 percent
- Manchester-Nashua, New Hampshire: 94.8 percent
- Anchorage, Alaska: 94.8 percent
- San Diego-Chula Vista-Carlsbad, California: 94.7 percent
- Bremerton-Silverdale-Port Orchard, Washington, and Barnstable Town, Massachusets (tie): 94.7 percent
Which is the least connected city in the U.S.?
The least connected city in the United States is in Brownsville-Harlington, Texas. This metropolitan statistical area is comprised of 137,982 households, 17 percent of which don’t have any type of internet connection. This means nearly one-fifth of the homes in this area don’t even have smartphones to access the internet! Five out of the top 10 least connected cities in the U.S. are in Texas. In addition to Brownsville-Harlingen, they include College Station-Bryan, Longview, Waco and Corpus Christi; all of which have at least 13.7 percent of their population without an internet subscription of any kind.
The 10 least connected cities in the U.S.
- Brownsville-Harlingen, Texas: 17 percent
- College Station-Bryan, Texas: 14.5 percent
- Charleston, West Virginia: 14.2 percent
- Mobile, Alabama: 14 percent
- Springfield, Missouri: 13.9 percent
- Longview, Texas: 13.9 percent
- Waco, Texas: 13.8 percent
- Corpus Christi, Texas: 13.7 percent
- Shreveport-Bossier City, Louisiana: 13.6 percent
- Canton-Massillon, Ohio, and Tuscaloosa, Alabama (tie): 13.5 percent
What is the most common type of internet connection in the U.S.?
Of the 130 million households in the United States, 91.2 percent are connected to the internet in some way. The most common type of internet connection is through a cellular data plan, which 85.3 percent of all U.S. households have. Three-quarters of Americans have access to the internet through broadband like cable, fiber optic or DSL; while 6.7 percent of U.S. households access the internet through a satellite.
How many Americans have no access to the internet? Roughly 11.5 million households, or 8.8 percent of all households are without an internet subscription.
Which U.S. city has the most households with a cellular data plan?
The highest rate of households with a cellular data plan is the San Jose-Sunnyvale-Santa Clara, California, metropolitan area where 92.3 percent of all households use their cellphone to connect to the internet in addition to other types of broadband. An additional three metro areas in California also made the top 10 list for having the most households with a cellular data plan: San Francisco-Oakland-Berkeley (91 percent), San Diego-Chula Vista-Carlsbad (90.8 percent), and Oxnard-Thousand Oaks-Ventura (89.6 percent).
The data collected from the American Community Survey also included households where the only method of connecting to the internet is with a cellular data plan. The top city for this statistic turned out to be Brownsville-Harlingen, Texas, where nearly one-third, 28.2 percent, of households can only access the internet through a smartphone. Two areas of California round out the top three with 19.5 percent of households in Salinas and 17.5 percent of households in Bakersfield that only have access to the internet via cellular data.
Are you a business owner looking for a way to connect to the internet? Break free from traditional internet service providers that offer high bills with unpredictable reliability with Ooma Connect. Our business internet service provides a reliable network, built-in Wi-Fi®, and 24/7 customer support with transparent pricing and tiered price plans to keep our customers from overspending on internet services. Ooma Connect also pairs perfectly with our small business phone systems. Check out our business phone plans today.
The most connected U.S. cities
| Metropolitan Statistical Area | Total Households | Cellular Data Plan | Broadband (such as cable, fiber optic or DSL) | Satellite Internet Service | Broadband of Any Type | |
| 1 | Boulder, CO | 137,786 | 90.4% | 87.3% | 5.1% | 95.5% |
| 2 | San Jose-Sunnyvale-Santa Clara, CA | 677,087 | 92.3% | 84.9% | 5.5% | 95.4% |
| 2 | Santa Rosa-Petaluma, CA | 194,698 | 89.8% | 83.8% | 6.6% | 95.4% |
| 4 | Ogden-Clearfield, UT | 235,531 | 91.9% | 83.8% | 8.1% | 95.3% |
| 5 | San Francisco-Oakland-Berkeley, CA | 1,739,127 | 91.0% | 84.7% | 5.7% | 94.9% |
| 5 | Washington-Arlington-Alexandria, DC-VA-MD-WV | 2,422,671 | 90.2% | 84.5% | 4.6% | 94.9% |
| 7 | Manchester-Nashua, NH | 167,816 | 88.0% | 86.7% | 2.6% | 94.8% |
| 7 | Anchorage, AK | 149,798 | 90.9% | 77.0% | 4.0% | 94.8% |
| 9 | San Diego-Chula Vista-Carlsbad, CA | 1,172,343 | 90.8% | 83.1% | 6.6% | 94.7% |
| 9 | Bremerton-Silverdale-Port Orchard, WA | 109,245 | 87.8% | 82.3% | 4.6% | 94.7% |
| 9 | Barnstable Town, MA | 107,187 | 88.0% | 84.8% | 3.6% | 94.7% |
| 12 | Seattle-Tacoma-Bellevue, WA | 1,611,580 | 89.3% | 85.0% | 4.0% | 94.6% |
| 13 | Naples-Marco Island, FL | 166,206 | 89.1% | 83.5% | 4.2% | 94.5% |
| 13 | Colorado Springs, CO | 306,162 | 88.9% | 81.5% | 6.4% | 94.5% |
| 13 | Boise City, ID | 302,858 | 89.2% | 79.3% | 8.7% | 94.5% |
| 16 | Austin-Round Rock-Georgetown, TX | 1,000,103 | 90.3% | 83.2% | 6.7% | 94.3% |
| 16 | Oxnard-Thousand Oaks-Ventura, CA | 278,631 | 89.6% | 82.9% | 7.3% | 94.3% |
| 16 | Crestview-Fort Walton Beach-Destin, FL | 123,619 | 88.6% | 80.7% | 6.0% | 94.3% |
| 16 | San Luis Obispo-Paso Robles, CA | 111,713 | 89.6% | 76.5% | 11.1% | 94.3% |
| 20 | Salt Lake City, UT | 448,172 | 90.4% | 82.8% | 6.1% | 94.1% |
| 20 | Portland-Vancouver-Hillsboro, OR-WA | 1,011,708 | 89.3% | 83.7% | 4.8% | 94.1% |
| 20 | Palm Bay-Melbourne-Titusville, FL | 255,723 | 87.8% | 83.3% | 5.6% | 94.1% |
| 23 | Atlanta-Sandy Springs-Alpharetta, GA | 2,311,639 | 89.4% | 81.8% | 7.6% | 93.9% |
| 23 | Denver-Aurora-Lakewood, CO | 1,223,825 | 88.3% | 83.2% | 6.5% | 93.9% |
| 23 | Sacramento-Roseville-Folsom, CA | 884,646 | 88.9% | 79.3% | 8.3% | 93.9% |
| 23 | Olympia-Lacey-Tumwater, WA | 118,571 | 88.8% | 83.4% | 4.4% | 93.9% |
The least connected U.S. cities: the most households without an internet subscription
| Metropolitan Statistical Area | Total Households | Percent of Households Without an Internet Subscription | |
| 1 | Brownsville-Harlingen, TX | 137,982 | 17% |
| 2 | College Station-Bryan, TX | 109,360 | 14.5% |
| 3 | Charleston, WV | 107,179 | 14.2% |
| 4 | Mobile, AL | 168,967 | 14% |
| 5 | Springfield, MO | 199,835 | 13.9% |
| 5 | Longview, TX | 109,049 | 13.9% |
| 7 | Waco, TX | 100,777 | 13.8% |
| 8 | Corpus Christi, TX | 156,365 | 13.7% |
| 9 | Shreveport-Bossier City, LA | 157,155 | 13.6% |
| 10 | Canton-Massillon, OH | 166,456 | 13.5% |
| 10 | Tuscaloosa, AL | 106,516 | 13.5% |
| 12 | Kingsport-Bristol, TN-VA | 132,965 | 13.2% |
| 13 | Roanoke, VA | 133,108 | 13.1% |
| 14 | Huntington-Ashland, WV-KY-OH | 147,441 | 12.7% |
| 15 | Gulfport-Biloxi, MS | 170,440 | 12.4% |
| 15 | Hickory-Lenoir-Morganton, NC | 151,501 | 12.4% |
| 17 | New Orleans-Metairie, LA | 499,885 | 12.2% |
| 17 | Columbus, GA-AL | 125,934 | 12.2% |
| 17 | Lynchburg, VA | 102,617 | 12.2% |
| 20 | Lafayette, LA | 194,293 | 12% |
| 20 | Utica-Rome, NY | 123,639 | 12% |
| 22 | Youngstown-Warren-Boardman, OH-PA | 229,685 | 11.9% |
| 23 | Beaumont-Port Arthur, TX | 152,263 | 11.8% |
| 24 | Augusta-Richmond County, GA-SC | 232,374 | 11.6% |
| 24 | Spartanburg, SC | 133,018 | 11.6% |
| 24 | Kalamazoo-Portage, MI | 108,397 | 11.6% |
What cities are the most connected through each internet connection type?
The 5 cities with the most households with a cellular data plan
| Metropolitan Statistical Area | Total Households | Percent of Households with a Cellular Data Plan | |
| 1 | San Jose-Sunnyvale-Santa Clara, CA | 677,087 | 92.3% |
| 2 | Ogden-Clearfield, UT | 235,531 | 91.9% |
| 3 | San Francisco-Oakland-Berkeley, CA | 1,739,127 | 91% |
| 4 | Anchorage, AK | 149,798 | 90.9% |
| 5 | San Diego-Chula Vista-Carlsbad, CA | 1,172,343 | 90.8% |
The 5 cities with the most households with only a cellular data plan
| Metropolitan Statistical Area | Total Households | Percent of Households with a Cellular Data Plan as the Only Type of Internet Subscription | |
| 1 | Brownsville-Harlingen, TX | 137,982 | 28.2% |
| 2 | Salinas, CA | 132,411 | 19.5% |
| 3 | Bakersfield, CA | 283,510 | 17.5% |
| 4 | McAllen-Edinburg-Mission, TX | 270,891 | 17.3% |
| 5 | Shreveport-Bossier City, LA | 157,155 | 17% |
The 5 cities with the most households with broadband (such as cable, fiber optic or DSL)
| Metropolitan Statistical Area | Total Households | Percent of Households with Broadband (such as cable, fiber optic or DSL) | |
| 1 | Boulder, CO | 137,786 | 87.3% |
| 2 | Manchester-Nashua, NH | 167,816 | 86.7% |
| 3 | Seattle-Tacoma-Bellevue, WA | 1,611,580 | 85% |
| 4 | San Jose-Sunnyvale-Santa Clara, CA | 677,087 | 84.9% |
| 5 | Barnstable Town, MA | 107,187 | 84.8% |
The 5 cities with the most households with satellite internet service
| Metropolitan Statistical Area | Total Households | Percent of Households with Satellite Internet Service | |
| 1 | Visalia, CA | 143,129 | 13.8% |
| 2 | Prescott Valley-Prescott, AZ | 110,928 | 12.9% |
| 3 | Greeley, CO | 123,825 | 12.4% |
| 4 | Longview, TX | 109,049 | 11.9% |
| 5 | Modesto, CA | 177,101 | 11.8% |
Diane Balogh has more than 10 years of experience researching, editing and writing for and about the telecommunications industry. Her blog posts have appeared on ooma.com, TechBuzz.att.com, OnSIP.com and Talkatone.com. A graduate of the University of Missouri School of Journalism with an area of emphasis in science writing, she specializes in translating complex topics into language that is easy to understand.